Find Max, Min, Average value from a DataTable UiPath
In the business automation process we always use DataTable.
Assuming we are working with some marks of a student or any other financial calculations of any process.
Let’s see the implementation of finding max min and average values from a DataTable.
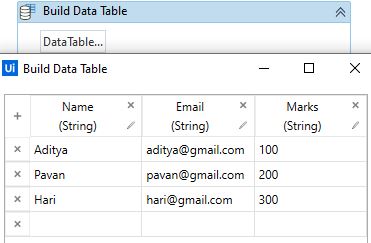
Step1: Drag and Drop a Build DataTable Activity and build a datatable as shown below:
Step2: As we have the datatable ready now we need to get the max value from it.
Use the below-mentioned Syntax to get the maximum value from the DataTable:
DT.AsEnumerable().Max(Function(row) cint(row(“ColumnName”)))Create a variable which can hold this max value as shown below:
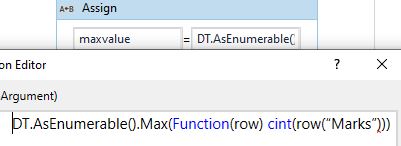
Here in the place of columnName entire the column for which you want to calculate Max Value.
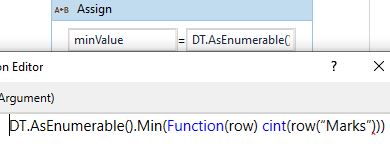
Step3: Now we will see how we can calculate the minimum value from the datatable.
Use the below mentioned syntax to get the minimum value from DataTable:
DT.AsEnumerable().Min(Function(row) cint(row(“ColumnName”)))Create a variable which can hold this minimum value as shown below:
Step4: Finally, we will see how to get the average value from the datatable.
Use the below syntax to get the average value from DataTable:
DT.AsEnumerable().Average(Function(row) cint(row(“ColumnName”)))Create a variable which can hold this average value as shown below:

This is how you calculate the max min and average values from a DataTable using UiPath.
Now let’s see the outputs of these Assign activity values one after the other as shown below:
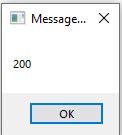
The maximum value from DataTable is shown below:

The minimum value from DataTable as shown below:

The average value from DataTable as shown below:
This task will be useful while you are working on a business process that is related to finance or any process which has numbers calculation.
How we do this when data is double type data?
Hi, you can convert it to different data type like CInt(variable)